Week 3-1 of the AWS MLops: ML steps, pipeline, and AWS SageMaker
Machine Learning Pipeline and AWS SageMaker#
Forming business problem#
Define business objective, questions to ask:
- How is this task done today?
- How will the business measure success?
- How will the solution be used?
- Do similar solutions exist?
- What are the assumptions?
- Who are the domain experts?
Frame the business problem
- Is it a machine learning problem? What kind of ML problem is it? Classification or regression?
- Is the problem supervised or unsupervised?
- What is the target to predict?
- Have access to the relevant data?
- What is the minimum or baseline performance?
- Would you solve the problem manually?
- What is the simplest solution?
- Can the success be measured?
Collect and secure data, ETL#
Data sources
- Private data
- Commercial data: AWS Data Exchange, AWS Marketplace, $\ldots$
- Open-source data
- Kaggle
- World Health Organization
- US Census Bureau
- National Oceanic and Atmospheric Administration
- UC Irvine Machine Learning repository
- AWS
- Critical question: Is you data representative?
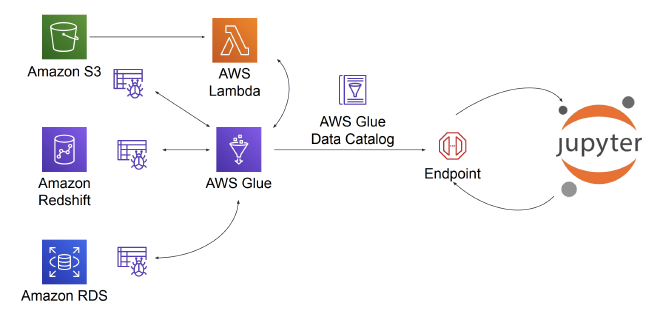
ETL with AWS Glue
- Runs the ETL process
- Crawls data sources to create catalogs that can be queried
- ML functionality
- AWS Glue can glue together different datasets and emit a single endpoint that can be queried

Data security: Access control and Data encryption
- Control access using AWS Identity and Access Management (IAM) policy
- AWS S3 default encryption
- AWS RDS encryption
- AWS CloudTrail: tracks user activity and application programing interface (API) usage
Data evaluation#
- Make sure the data is in the correct format
- Use descriptive statistics to gain insights into the dataset before cleaning the data
- Overall statistics
- Categorical statistics can identify frequency of values and class imbalances
- Multivariate statistics
- Scatter plot to inspect the correlation between two variables
pandasprovidesscatter_matrixmethod to examine multivariate correlations- Correlation matrix and heat map
- Attribute statistics
- Overall statistics
Feature engineering#
Feature extraction
Data encoding
- Categorical data must be converted to a numeric scale
- If data is non-ordinal, the encoded value must be non-ordinal which might need to be broken into multiple categories
Data cleaning
- Variations in strings: text standardization
- Variations in scale: scale normalization
- Columns with multiple data items: parse into multiple columns
- Missing data:
- Cause of missing data:
- undefined values
- data collection errors
- data cleaning errors
- Plan for missing data: ask the following questions first
- What were the mechanisms causing the missing data?
- Are values missing at random?
- Are rows or columns missing that you are not aware of?
- Standard approaches
- Dropping missing data
- Imputing missing data
- Cause of missing data:
- Outliers
- Finding the outliers: box plots or scatter plots for visualization
- Dealing with outliers:
- Delete - e.g. outliers were created by artificial errors
- Transform - reduce the variation
- Impute - e.g. use mean for the outliers
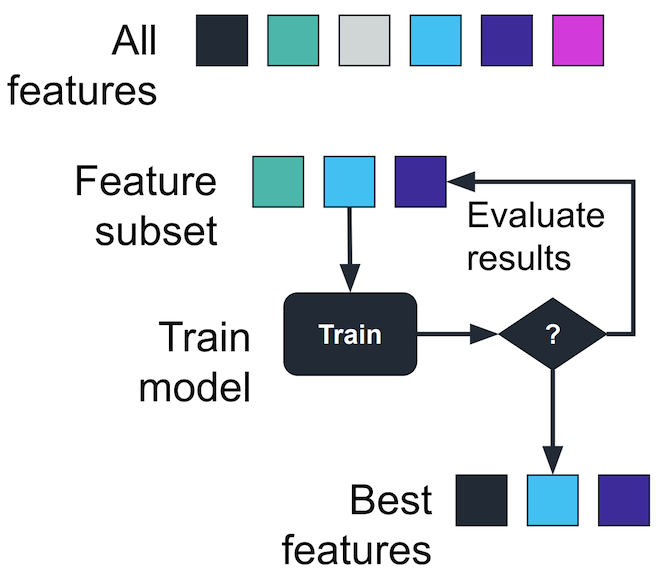
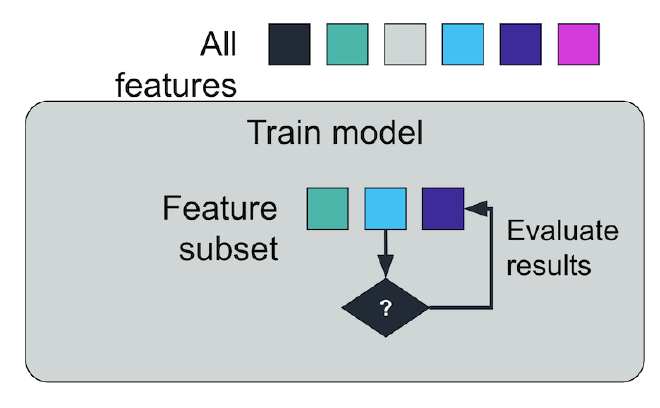
Feature selection
Filter method
- Pearson’s correlation
- Linear discriminant analysis (LDA)
- Analysis of variance (ANOVA)
- Chi-square $\chi^2$ analysis
Wrapper method
- Forward selection
- Backward selection

</figure>Embedded method
- Decision trees
- LASSO and RIDGE

</figure>
Model training and evaluation#
Holdout method
- Split the data into training and test sets
- The model is trained on the training set. Afterwards, its performance is evaluated by testing the model on the test set data which the model has never touched.
- Advantage: straightforward to implement and computationally cheap because training and testing are carried out once each.
- Disadvantage:
- It could happen that the test set and the training set have different statistical distributions, i.e. the test set data cannot faithfully represent the training set distribution. In this case, the validation result is likely not accurate.
- If we tune the model based on a single test set, we may end up overfitting the test data set.
- While this approach can be improved by using training, validation, and test set, the result might still depend on the way data sets are prepared, leading to some degrees of bias.
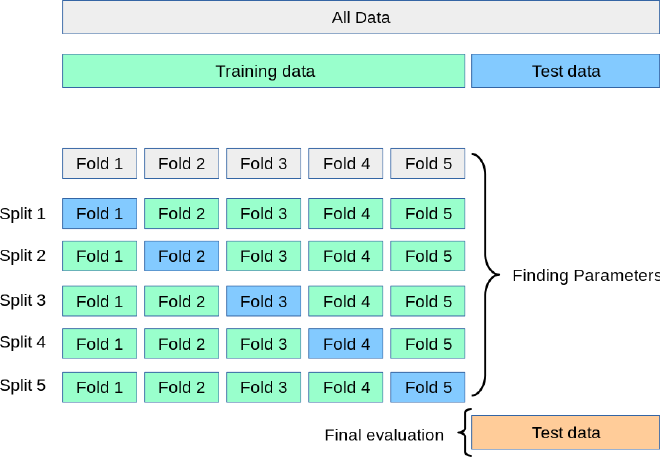
$k$-fold cross-validation method, an evaluation method that minimizes the disadvantages of the holdout method.
- Divide the whole data set into training and test set.
- Shuffle the training set randomly, if possible.1
- Split the training set into $k$ non-overlapping subsets (folds) that are equally partitioned, if possible.
- For each of the $k$ folds:
- Train a new model on the $k-1$ folds and validate using the remaining fold.
- Retain the evaluation score and discard the model.
- The performance metric is obtained by averaging the $k$ evaluation scores.
- The test set is used for final evaluation.

</figure>- To avoid data leakage, any feature engineering should be carried out separately for training and validation inside the CV loop.
- Reference for practical advice on cross-validation, including imbalanced data set
Evaluation
- Classification problems
- Confusion matrix
- F1 score, the harmonic mean of precision and sensitivity
- AUC-ROC
- Regression
- Mean squared error
- Classification problems
Model tuning#
- Amazon Sagemaker offers automated hyperparamter tuning
- Best practices
- Don’t adjust every hyperparameter
- Limit the range of values to what’s most effective
- Run one training job at a time instead of multiple jobs in parallel
- In distributed training jobs, make sure that the objective metric that you want is the one that is reported back
- With Amazon SageMaker, convert log-scaled hyperparameters to linear-scaled when possible
]: Time-series data is ordered and can’t be shuffled. ↩︎